3.3. User Defined Charts
A user can create a new empty plot, and then customize it as explained in the previous section.
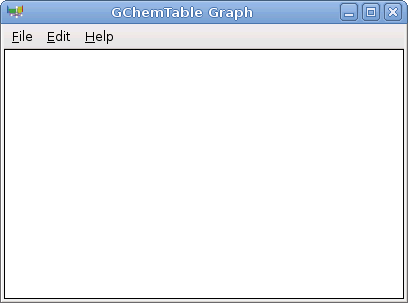
To create a new empty plot, choose +->. This will open two new windows: one containing the new chart, and one containing the chart properties dialog.
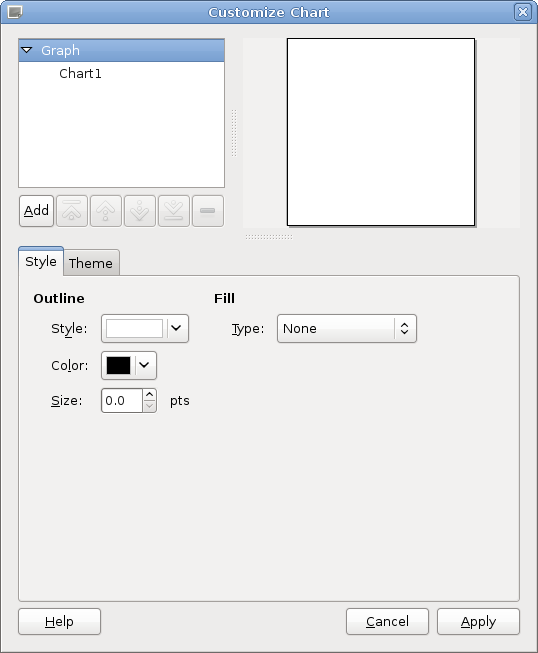
The graph contains just one empty chart. In most cases, the first thing to do is to add a new plot using the button as seen in next screenshot:
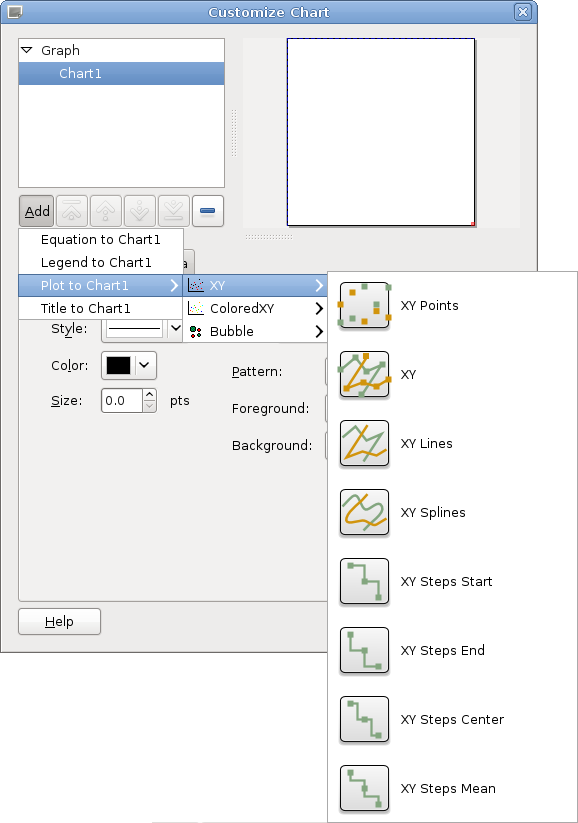
This adds not only a plot, but also a backplane, the two needed axes, and a data series to the plot.
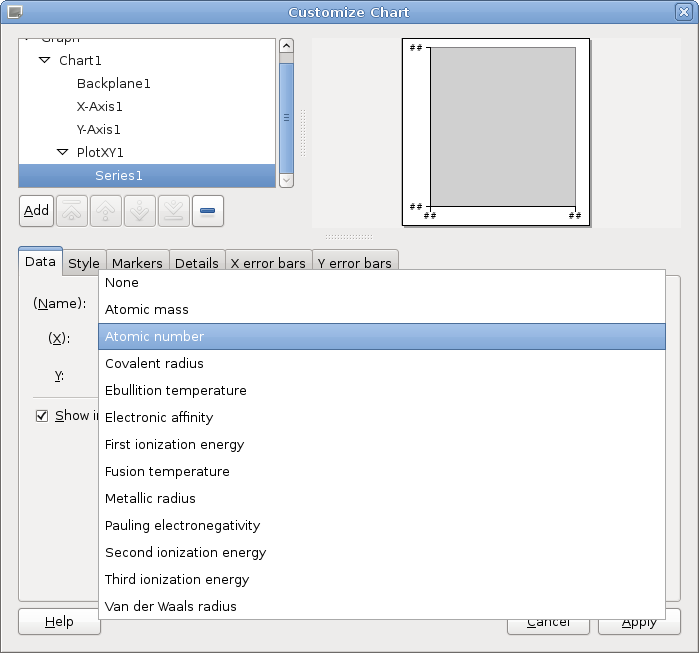
You can then select the data to use for the new series. Only predefined data vectors can be used. If X values are not selected, an integer series starting from 0 will be used; that is the atomic number minus one.
Further customization is explained in the previous section.