Chapter 2. Usage
2.1. To Customize the spectrum view
The customization options depend on the spectrum type.
When a spectrum is opened in a new window, the displayed data are those directly read from the file. The abscissa axis might be inverted in some cases, according to current usage.
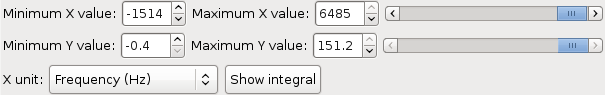
In the simplest case, the toolbar looks like:

You can set the values of the minimum and maximum displayed coordinates for both axes. These limiting values are constrained to be within the actual data intervals.
When only a part of the spectrum is displayed, the appropriate slider can be used to scroll through the spectrum view. The spectrum moves in the same direction as the horizontal slider and to the top when the Y axis slider is moved to the right.
When the spectrum is a UV-Visible spectrum, additional controls are available:
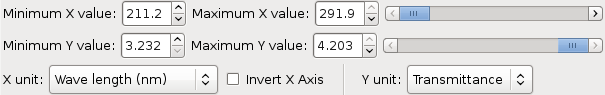
The abscissa can be switched between wavelength in nanometers and wave number in cm−1 and the axis inverted (high values at left) or not, and the ordinate can be either absorbance or transmittance.
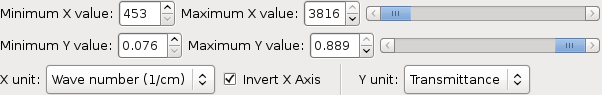
The toolbar is almost identical for IR spectra. The only difference is that wavelengths are in micrometers instead of nanometers:
The abscissa units available for NMR spectra are ppm and Hz. The intergation curve can also been displayed or hidden: