Chapter 3. Charts
3.1. Pre-defined Charts
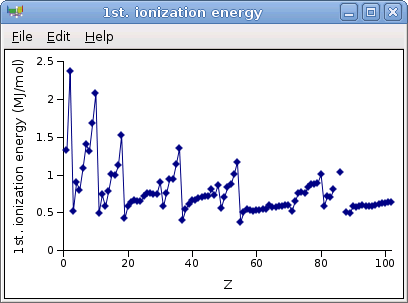
When you click on the button in the element window you obtain a chart such as:
Some charts can also be displayed by selecting one of the items in , except which creates a custom chart.
Consecutive points are joined by a segment. The absence of a segment means that at least one data point is missing.
Charts can be customized as explained in the next section.